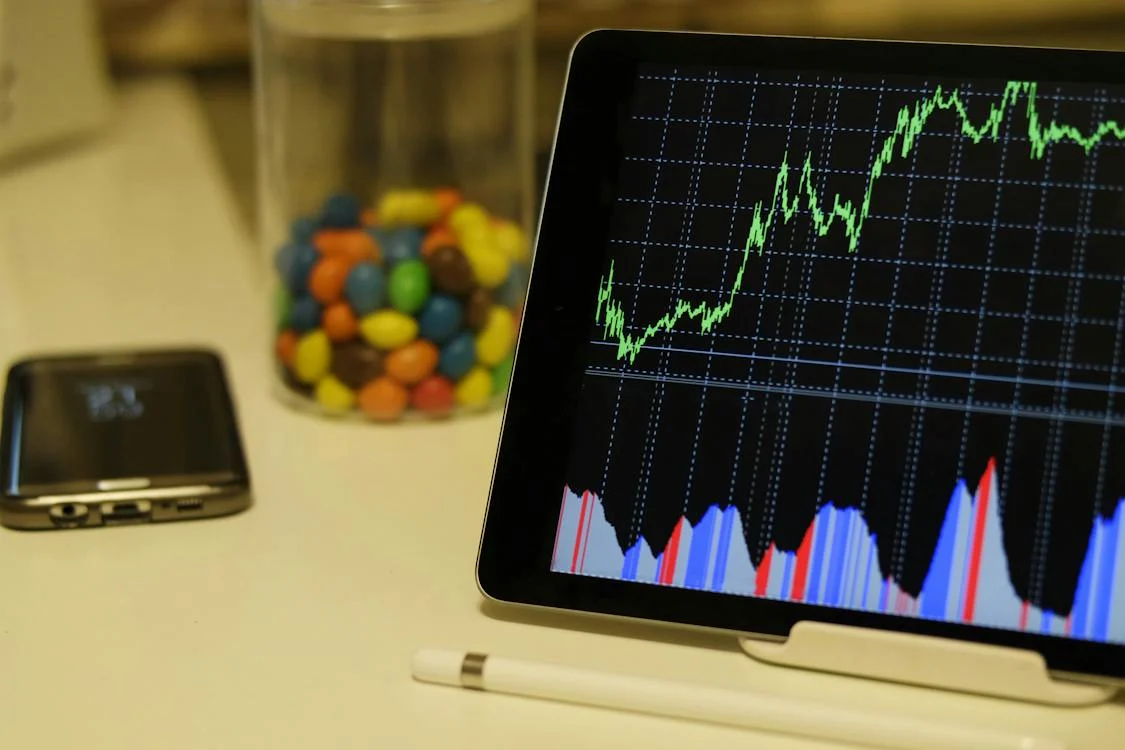
Understanding market trends is crucial for making wise decisions in financial markets. The candlestick chart serves as one such tool in this process. By visualizing price changes over a predetermined period, these charts give essential information about the mood of the market and possible future movements.
What are Candlestick Charts?
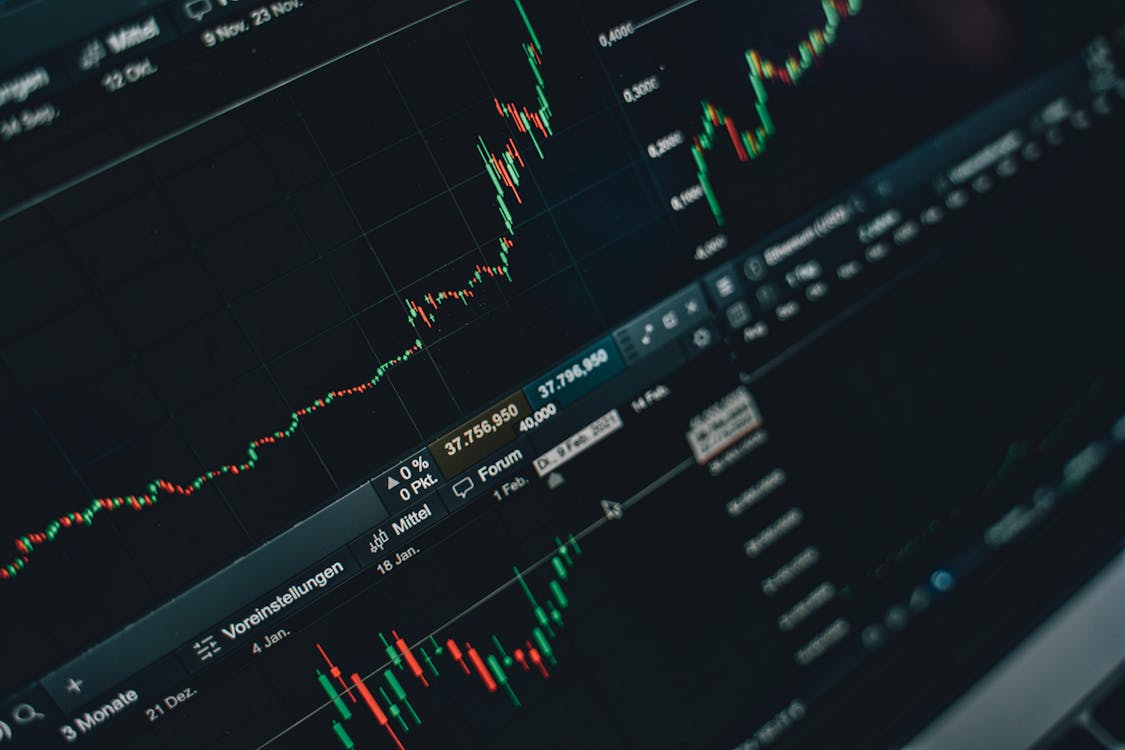
Since their introduction in Japan in the 18th century, candlestick charts have gained popularity to show price changes in financial markets. The four main pieces of information displayed by each candlestick on the chart within a given period are the opening, closing, highest, and lowest prices. This is represented by a particular time period, such as a day, week, or hour.
Popular Candelstick Patterns
- Doji: This pattern highlights market indecision, with the opening and closing prices almost identical.
- Hammer: Showing a possible reversal from a downtrend to an uptrend, the hammer pattern is distinguished by a long lower wick and a short body.
- Engulfing: A reversal in the current trend may be indicated when a candle's body entirely engulfs the preceding candle's body.
- Morning Star/Evening Star: These three-candle patterns suggest possible reversals. When an upward trend is in progress, the evening star emerges at its peak, and the morning star is at its lowest point.
Traders can obtain insights into market sentiment and possible future price movements by identifying these patterns and comprehending their implications.
How to Make Predictions and Decisions Using Candlestick Charts?
Candlestick charts offer visual indicators of market sentiment and possible trend reversals, which can assist traders in making forecasts and decisions. If a sequence of bullish candlestick patterns follows a prolonged downtrend, this could suggest a possible reversal to an uptrend and encourage traders to take advantage of buying opportunities. On the other hand, a string of bearish patterns following an uptrend may indicate that the trend is about to reverse, which would lead traders to think about shorting or selling positions.
What Is the Cup and Handle Pattern?
The cup and handle pattern resemble a teacup with a handle and is a bullish continuation pattern. It usually follows a protracted uptrend and is characterized by a rounded bottom, followed by a consolidation phase forming the handle. Traders frequently interpret this pattern as an indication of bullish sentiment, implying that the uptrend will probably continue.
What Is the Difference Between Day Trading and Swing Trading?
Two well-liked trading techniques, day trading and swing trading, vary in their timeframe. By entering and exiting positions quickly to take advantage of intraday volatility, day traders seek to profit from brief price movements within a single trading day. To capitalize on more significant price swings in the market, swing traders, on the other hand, hold positions for more extended periods, varying from a few days to several weeks.
Day Trading vs. Swing Trading: Pros and Cons
In addition to providing the opportunity for rapid profits, day trading shields traders from overnight market risk exposure. However, it can be stressful for novice traders and necessitates continuous price movement monitoring. Contrarily, swing trading offers greater flexibility and requires less time commitment, which makes it appropriate for traders with hectic schedules. However, it calls for perseverance and tolerating brief price swings.
Conclusion:
To summarise, candlestick charts help determine market trends and make wise trading choices. Traders can adjust their strategies based on their analysis of patterns and formations on these charts, which provides them with insights into future price movements and market sentiment. Adding candlestick analysis to your trading toolkit can help you better navigate the intricacies of financial markets, regardless of whether you're a swing or day trader

No comments yet